Total Households in California: 13,550,586
Households Using SNAP: 1,727,452 (12.7%)
Elderly Households: 5,680,919 with 760,661 using SNAP
Younger Households: 7,869,667 with 966,791 using SNAP
Married-Couple Families: 6,516,115 with 543,548 using SNAP
Single Male Householder: 870,396 with 170,201 using SNAP
Single Female Householder: 1,764,293 with 517,169 using SNAP
Households with Children: 4,319,672 with 814,628 using SNAP
Poverty Status: 1,638,044 below poverty with 603,773 using SNAP
Disability Status: 3,442,767 with a disability with 775,257 using SNAP
Racial Group - White: 6,425,859 with 566,602 using SNAP
Racial Group - Black or African American: 814,524 with 195,195 using SNAP
Racial Group - Asian: 2,064,774 with 228,364 using SNAP
Racial Group - Hispanic or Latino Origin: 4,220,481 with 758,168 using SNAP
The Supplemental Nutrition Assistance Program (SNAP), formerly known as the Food Stamp Program, plays a pivotal role in ensuring food security for millions of Americans. In California, a state known for its diverse population and economic disparities, SNAP serves as a lifeline for many households, helping them bridge the gap between their income and essential nutritional needs.
This article delves into the intricate details of SNAP usage in California, shedding light on the demographics of its beneficiaries and the broader implications for the state's socio-economic landscape.
SNAP is more than just a food assistance program. It's a catalyst for economic growth, a safety net for vulnerable populations, and a testament to society's commitment to ensuring that no one goes hungry.
Every dollar spent on SNAP generates about $1.50 in economic activity, benefiting local businesses and communities. Moreover, during economic downturns, SNAP acts as an automatic stabilizer, expanding to accommodate increased needs and contracting as the economy improves.
Total Households in California and Households Using SNAP
California, with its vast expanse and diverse population, is home to over 13.5 million households. Of these, a significant 12.7% rely on SNAP to meet their daily nutritional needs.
- This percentage translates to 1,727,452 households, a number that underscores the importance of SNAP in the state's social fabric.
While the state's economy thrives in various sectors, these numbers are a stark reminder of the disparities that exist and the challenges many Californians face in accessing basic necessities.
Age and SNAP Utilization
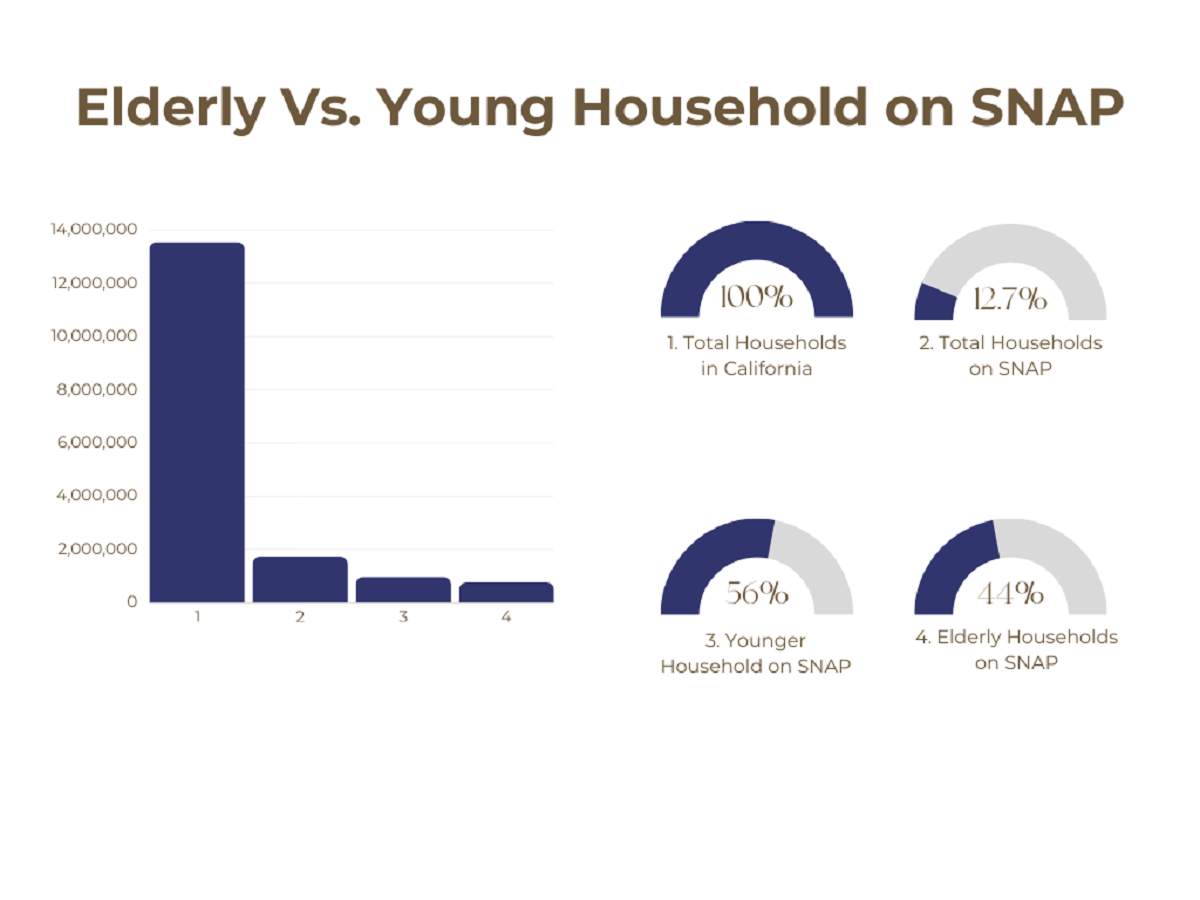
Elderly Households and SNAP
The elderly population, often living on fixed incomes, faces unique challenges when it comes to food security. In California, there are 5,680,919 households with one or more individuals aged 60 years and over. A significant portion of these households, 760,661 to be precise, rely on SNAP to supplement their nutritional needs. This reliance underscores the importance of SNAP in ensuring that the elderly, a vulnerable segment of the population, have consistent access to nutritious food.
- Total Elderly Households: 5,680,919
- Elderly Households Using SNAP: 760,661 (13.4%)
Younger Households and SNAP
Contrasting the elderly population, households without individuals aged 60 or over represent the younger demographic. These households, totaling 7,869,667, have a slightly higher reliance on SNAP, with 966,791 of them benefiting from the program.
- Total Younger Households: 7,869,667
Younger Households Using SNAP: 966,791 (12.3%)
Family Dynamics and SNAP Utilization
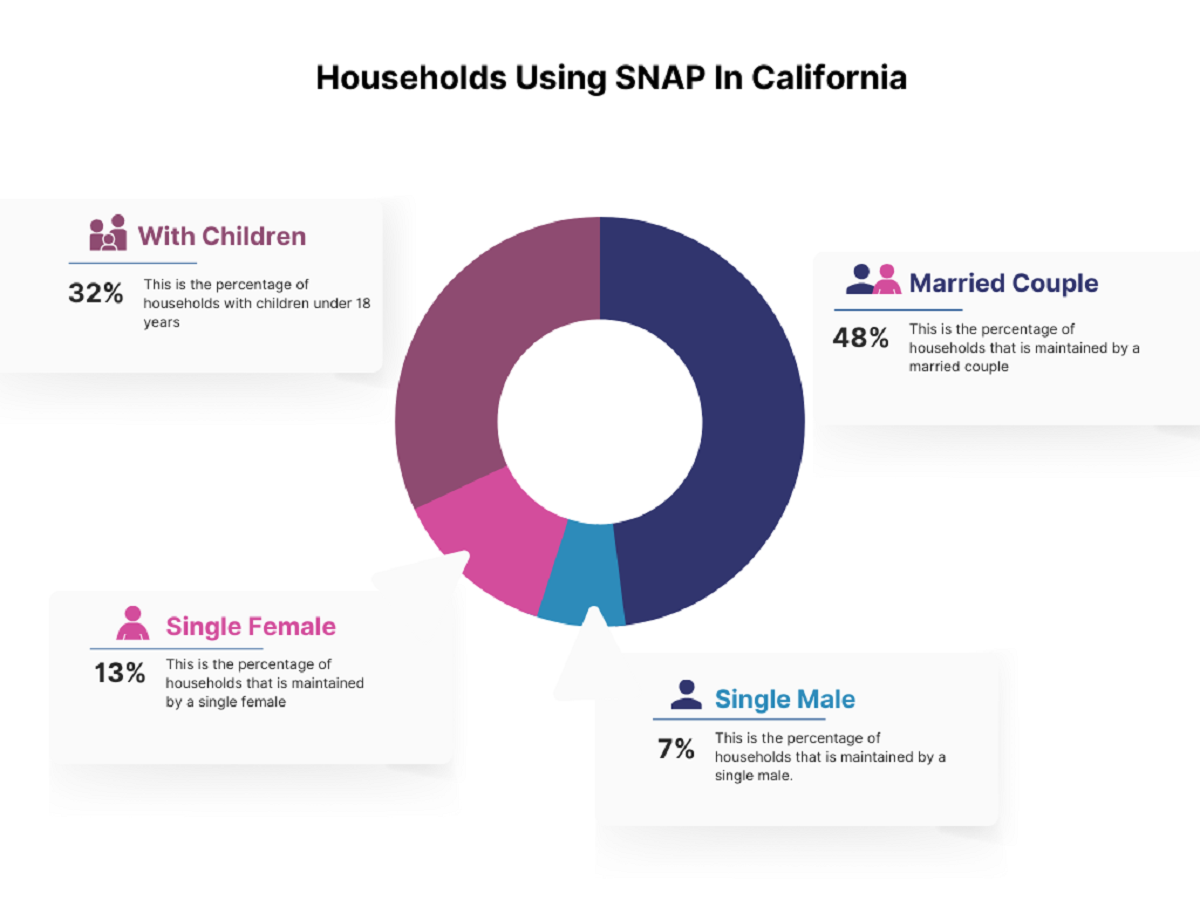
Married-Couple Families
Married-couple families often benefit from dual incomes, yet economic challenges can still make ends meet difficult. Out of the 6,516,115 married-couple families in California, 543,548 receive assistance from SNAP. This statistic highlights that even traditional family structures are not immune to economic hardships.
- Total Married-Couple Families: 6,516,115
- Married-Couple Families Using SNAP: 543,548 (8.3%)
Single Male Householder
Single male householders face their own challenges, especially if they are the sole breadwinners. Out of 870,396 such households in California, 170,201 rely on SNAP, emphasizing the program's role in supporting diverse family structures.
- Total Single Male Householder Families: 870,396
- Single Male Householder Families Using SNAP: 170,201 (19.5%)
Single Female Householder
Single female householders, often juggling multiple roles, represent a significant portion of SNAP beneficiaries. Of the 1,764,293 households led by a single female, 517,169 receive SNAP benefits. This data underscores the economic challenges faced by single mothers and the crucial role of SNAP in aiding them.
- Total Single Female Householder Families: 1,764,293
- Single Female Householder Families Using SNAP: 517,169 (29.3%)
Households with Children
Households with children under 18 often have increased expenses, making budgeting for nutritious meals challenging. Out of the 4,319,672 such households in California, a notable 814,628 receive SNAP benefits, ensuring the younger generation receives adequate nutrition.
- Total Households with Children: 4,319,672
- Households with Children Using SNAP: 814,628 (18.9%)
Disability and Poverty with SNAP
Poverty Status and SNAP
Economic disparities are evident when analyzing households below the poverty level. In California, 1,638,044 households live below the poverty line, and a staggering 603,773 of them rely on SNAP. This reliance is a clear indicator of the program's importance in addressing food insecurity among the economically disadvantaged.
- Total Households Below Poverty Level: 1,638,044
- Households Below Poverty Level Using SNAP: 603,773 (36.9%)
Disability Status and SNAP
Households with one or more individuals with a disability often face additional challenges, both economically and logistically. In California, there are 3,442,767 such households. A significant 775,257 of these households benefit from SNAP, highlighting the program's role in supporting families with special needs.
- Total Households with a Disability: 3,442,767
- Households with a Disability Using SNAP: 775,257 (22.5%)
Racial Profiles and Utilization of SNAP
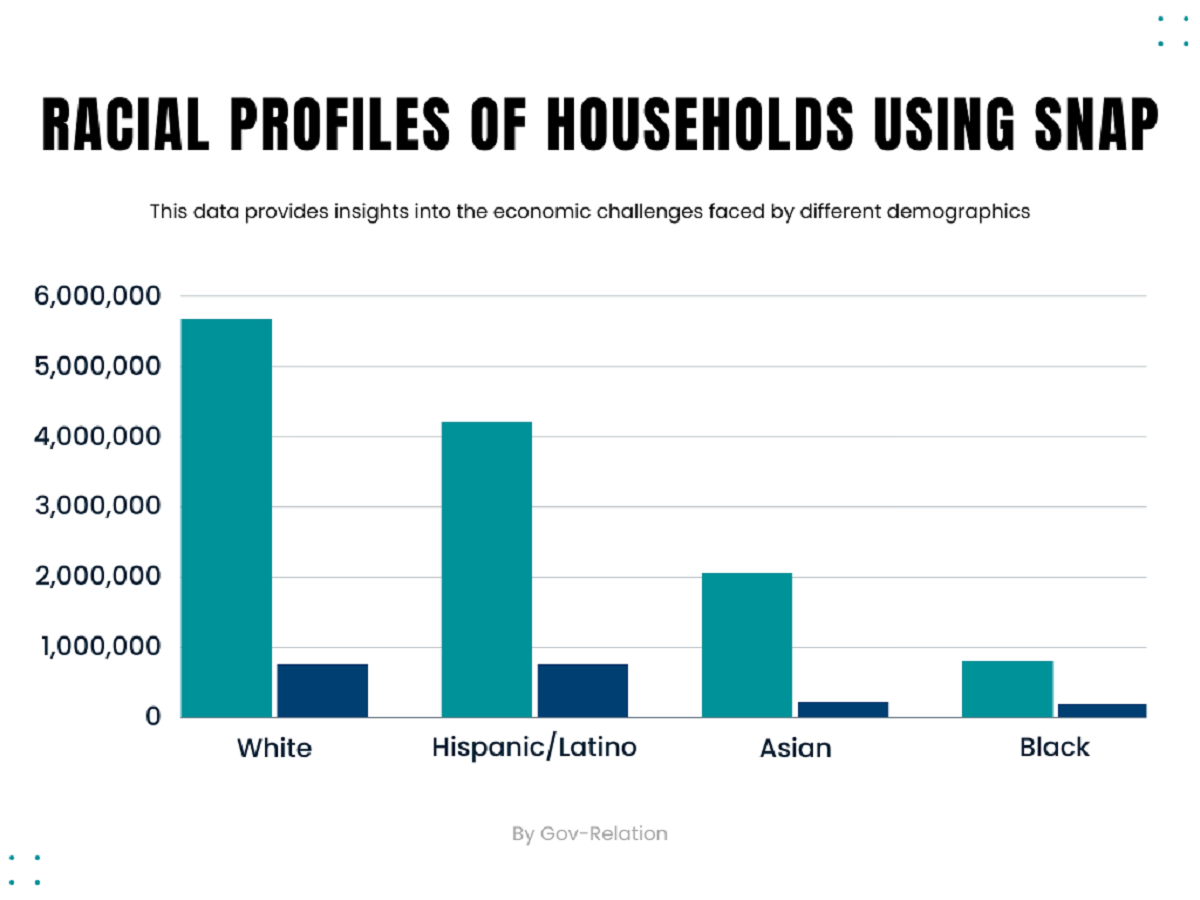
Racial Group - White
Race and ethnicity often intersect with economic disparities. Among households that identify as White, 6,425,859 in total, 566,602 receive SNAP benefits. This data provides insights into the economic challenges faced by this demographic.
- Total White Households: 6,425,859
- White Households Using SNAP: 566,602 (8.8%)
Racial Group - Black or African American
The Black or African American community in California comprises 814,524 households. A notable 195,195 of these households rely on SNAP, emphasizing the economic disparities and the importance of SNAP within this community.
- Total Black or African American Households: 814,524
- Black or African American Households Using SNAP: 195,195 (24%)
Racial Group - Asian
The Asian community, often perceived as economically prosperous, has its challenges. Of the 2,064,774 households that identify as Asian, 228,364 receive SNAP benefits, shedding light on the diverse economic realities within this community.
- Total Asian Households: 2,064,774
- Asian Households Using SNAP: 228,364 (11.1%)
Racial Group - Hispanic or Latino Origin
The Hispanic or Latino community, representing a significant portion of California's population, comprises 4,220,481 households. Of these, 758,168 households benefit from SNAP, highlighting the program's importance in this vibrant and diverse community.
- Total Hispanic or Latino Origin Households: 4,220,481
- Hispanic or Latino Origin Households Using SNAP: 758,168 (18%)
Racial Group - Other Categories
Other racial groups, including American Indians, Native Hawaiians, and those identifying with two or more races, also have significant portions relying on SNAP. These numbers emphasize the program's widespread impact across various racial and ethnic groups.
- American Indian and Alaska Native: 157,658 households, with 28,854 using SNAP.
- Native Hawaiian and Other Pacific Islander: 46,769 households with 8,390 using SNAP.
- Other Race: 2,010,558 households with 379,217 using SNAP.
- Two or More Races Mixed: 2,030,444 households with 320,830 using SNAP.
Final Thoughts
The Supplemental Nutrition Assistance Program (SNAP) ensures food security for a diverse range of Californians. From households with elderly members to those led by single parents, from racial and ethnic minorities to families with members with disabilities, SNAP's reach is vast, and its impact is profound.
As California grapples with economic disparities, programs like SNAP remain essential in ensuring that all residents have access to nutritious food, regardless of socio-economic status. The numbers speak for themselves, emphasizing the program's significance in the state's social and economic fabric.
To get a better idea of CalFresh and SNAP’s food assistance programs, read through our resources at Gov-relations today.
Do you find this article insightful and relevant to your audience? We've poured our expertise and rigorous research into crafting this piece. We're just a message away if you want to link to our article! Reach out to us through our contact form, and let's discuss how we can collaboratively contribute to an informed and engaged readership.