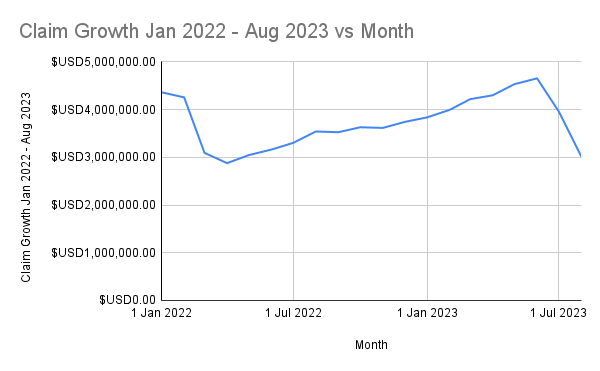
January 2022 Kickoff: Connecticut began 2022 with a claim amount of $4,362,816.
February Slight Decline: In February 2022, the claim amount slightly decreased to $4,257,021.
March 2022 Dip: The claim amount significantly dropped to $3,094,396 in March 2022.
April 2022 Low Point: The lowest claim amount for the year was recorded in April 2022 at $2,878,018.
Recovery in May: May 2022 showed a recovery with claim amounts increasing to $3,047,228.
Steady Rise in Mid-2022: June and July 2022 saw a steady rise in claim amounts, reaching $3,162,688 and $3,303,458, respectively.
August 2022 Increase: By August 2022, the claim amount had increased to $3,541,766.
End of 2022 Analysis: The latter months of 2022 are crucial for understanding the year-end financial trends.
January 2023 Reassessment: January 2023's claim amount is pivotal for year-on-year growth assessment.
February 2023 Continuation: The claim amount in February 2023 provides insights into early-year trends.
March 2023 Comparison: March 2023's claim amount compared to the previous year's low in March is essential for trend analysis.
April 2023 Year-on-Year: April 2023's data compares directly to January 2022's lowest point.
Mid-2023 Trends: The May to July 2023 claim amounts are crucial for understanding mid-year economic trends.
August 2023 Contextualization: The claim amount in August 2023, at $4,522,650, serves as a recent benchmark.
Connecticut's Affordable Connectivity Program (ACP) has been a critical initiative, providing essential support to eligible households. This program's impact is a matter of policy and profound economic significance. As we delve into the data from January 2022 to August 2023, a fascinating narrative reveals the dynamics of claim amounts and their implications.
A Tiny Dip in the Latter Part of Q2: Comparison with August 2023
The trend of claim amounts in Connecticut under the ACP program from January 2022 to August 2023 shows a fascinating journey of fluctuations and recoveries. Compared to August 2023, each month's data provides a unique insight into the program's impact and the economic conditions influencing these claims.
- Early 2022 Fluctuations: The initial months of 2022 started with higher claim amounts than in August 2023, but a downward trend was observed leading into mid-2022.
- Mid-Year Recovery: Starting from May 2022, there was a gradual recovery, with claim amounts consistently rising, though still not reaching the August 2023 levels.
- Year-End Trends: The end of 2022 and the beginning of 2023 are critical for understanding the overall yearly trend and its comparison with August 2023.
The Early Months: A Story of Fluctuations and Recovery
The journey of Connecticut's ACP claim amounts in 2022 began with fluctuations, which set the stage for the rest of the year. These early months are crucial in understanding the program's impact on eligible households and the state's economic health.
January 2022: The Starting Point
- Initial Benchmark: Connecticut's ACP program kicked off 2022 with a claim amount of $4,362,816.
- Setting the Stage: This initial figure established a benchmark for subsequent months, providing a starting point for year-long trend analysis.
February 2022: A Slight Decline
- Minor Decrease: In February, the claim amount saw a slight decrease to $4,257,021.
- Early Indication: This early decline hinted at the variability that would characterize the ACP claim amounts throughout the year.
March 2022: The Significant Dip
- Notable Drop: March witnessed a significant drop in claim amounts, plummeting to $3,094,396.
- Economic Implications: This marked the lowest point in the first quarter, possibly reflecting broader economic trends or changes in program participation.
April 2022: The Lowest Ebb
- Year's Low: April recorded the lowest claim amount for the year at $2,878,018.
- Analytical Insight: This low point offers a critical perspective for understanding the fluctuations in ACP claims and their underlying causes.
May 2022: Signs of Recovery
- Reversing the Trend: May showed signs of recovery, with claims increasing to $3,047,228.
- Hopeful Turnaround: This increase suggested a potential turnaround in the trend, sparking interest in the program's mid-year performance.
June and July 2022: Steady Ascend
- Consistent Increase: June and July continued the upward trend with claims of $3,162,688 and $3,303,458, respectively.
- Mid-Year Analysis: These months are pivotal for mid-year analysis, indicating a steady recovery in the ACP claim amounts.
August 2022: Continuing the Upward Trajectory
- Further Growth: By August 2022, the claim amount had increased to $3,541,766.
- Setting a Precedent: This continued growth set a precedent for the latter half of the year, leading to speculations about year-end trends.
As Connecticut moved through the latter half of 2022 and into 2023, the ACP claim amounts revealed more about the state's economic resilience and the evolving needs of its residents.
End of 2022: A Crucial Period for Analysis
- Year-End Trends: The claim amounts in the latter months of 2022 are key to understanding the year-end financial trends.
- Economic Indicators: These figures indicate Connecticut's economic health and the ACP's effectiveness during this period.
January 2023: A New Year's Assessment
- Year-on-Year Comparison: The claim amount in January 2023 is crucial for assessing growth or decline compared to January 2022.
- Setting the Tone for 2023: This month's data sets the tone for the new year, providing insights into the ongoing impact of the ACP.
February 2023: Consistency or Variability
- Early-Year Trends: The claim amount in February 2023 offers a glimpse into the consistency or changes in early-year trends.
- Predicting Future Movements: Understanding these figures helps predict the direction of claim amounts for the rest of the year.
April 2023: Year-on-Year Reflection
- Direct Comparison: April 2023's data directly compares to the previous year's lowest point in April 2022.
- Understanding Recovery: This comparison is essential to understand the extent of recovery or further decline in claim amounts.
June 2023: A Surprising Peak
- Significant Increase: June 2023 saw a surprising peak in claim amounts, reaching $4,654,951.
- Analyzing the Spike: This increase, the highest over a year, warrants a deep dive into the factors contributing to such a significant rise.
Mid-2023: Understanding the Economic Pulse
- Mid-Year Economic Trends: The claim amounts from May to July 2023 are crucial for grasping the mid-year economic trends in Connecticut.
- Predictive Analysis: These figures can be used for predictive analysis of the ACP's impact for the remainder of the year.
August 2023: The Current Benchmark
- Recent Data Point: The claim amount in August 2023, standing at $4,522,650, serves as the most recent benchmark.
- Current Year Analysis: This figure is essential for current year analyses and comparisons with the previous year, providing a fresh perspective on the ACP's trajectory.
Conclusion
The journey of Connecticut's Affordable Connectivity Program claim from January 2022 to August 2023 paints a vivid picture of the state's economic landscape and the program's pivotal role. The fluctuations, the lows and highs, and the eventual stabilization offer valuable insights into the program's efficacy and the economic conditions affecting it.
As journalists and analysts delve into these numbers, they uncover stories of resilience, challenge, and recovery, reflecting the real-world impact of such programs on everyday lives. This data-driven narrative informs policy decisions and connects the dots between economic policies and their tangible outcomes in the community.
To get a better idea of how the ACP and Lifelines services differ, read through our resources at Gov-relations today.
Do you find this article insightful and relevant to your audience? We've poured our expertise and rigorous research into crafting this piece. We're just a message away if you want to link to our article! Reach out to us through our contact form, and let's discuss how we can collaboratively contribute to an informed and engaged readership.

- ACP Claims by Zip Code (January – December 2022)
- ACP Claims by Zip Code (January – August 2023)
- ACP Claims by County (January – December 2022)
- ACP Claims by County (January – August 2023)
- ACP Households by Zip Code (January – June 2022)
- ACP Households by Zip Code (July – December 2022)
- ACP Households by Zip Code (January – August 2023)
- ACP Households by County (January – December 2022)
- ACP Households by County (January – August 2023)
- Federal Communications Commission. "Affordable Connectivity Program." FCC, https://www.fcc.gov/acp. Accessed 9 Nov. 2023.
- U.S. Congress. "H.R.3684 - Infrastructure Investment and Jobs Act." Congress.gov, https://www.congress.gov/bill/117th-congress/house-bill/3684. Accessed 9 Nov. 2023.