Total Claims Overview: From January 2022 to August 2023, Minnesota's total claim amount was 2,806,738.
Highest Claim Amount: The highest total claim amount was in June 2023 with 193,377.
Lowest Claim Amount: The lowest total claim amount was in January 2022 with 77,532.
Yearly Comparison: Total claim amounts for 2022 and 2023 (up to August) were 1,405,388 and 1,401,350, respectively.
Average Monthly Claim: The average monthly claim amount over this period was approximately 140,337.
August 2023 Specifics: The total claim amount for August 2023 was 147,523.
Significant Changes: Notable changes occurred in August 2023, August 2022, and July 2022.
Seasonal Trends: Indicate average claim amounts of approximately 117,116 and 175,169 in respective quarters.
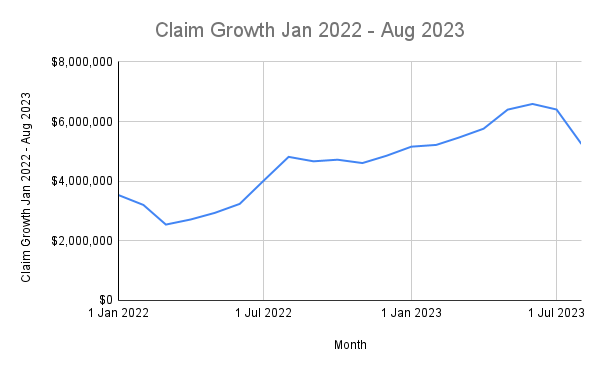
Long-Term Trend: An increasing trend in claim amounts was observed over the entire period.
The Affordable Connectivity Program (ACP) in Minnesota has been a cornerstone in bridging the digital divide, offering essential support to ensure broad and equitable access to connectivity. This analysis delves into the ACP's impact over a period from January 2022 to August 2023, a critical time frame that witnessed significant fluctuations and trends in claim amounts. Understanding these trends is vital not just for policymakers and stakeholders in Minnesota but also for those looking to glean insights into the efficacy and reach of such programs.
This comprehensive analysis explores Minnesota's Affordable Connectivity Program (ACP) claim trends from January 2022 to August 2023, featuring a record claim amount of $193,377 in June 2023.
Fast Facts
Minnesota's ACP experienced the highest claim amount of $193,377 in June 2023, underscoring a growing reliance on digital connectivity aid.
Comparison Of Claim Amount Trend
- Overall Trend: We will examine how the claim amounts have changed month-to-month to understand whether they have generally increased, decreased, or remained stable.
- August 2023 Comparison: Specifically, we'll compare the claim amount in August 2023 with the previous months to highlight any significant changes or anomalies.
In-depth Analysis Of Key Points
Total Claims Overview
The period from January 2022 to August 2023 was a significant time for the ACP in Minnesota, marked by a total claim amount of 2,806,738.
- Growth Indicator: This figure indicates not just the scale of the program but also the growing need and reliance on such initiatives.
- Policy Implications: It suggests the ongoing relevance and potential areas of expansion for the ACP.
Highest Claim Amount
June 2023 stood out with the highest claim amount of 193,377, a pivotal month for the ACP in Minnesota.
- Record-Breaking Month: This peak reflects an unprecedented level of claims, possibly driven by increased awareness or enhanced need.
- Analyzing The Cause: Understanding the factors leading to this surge can provide valuable insights for future program adjustments.
Lowest Claim Amount
January 2022 witnessed the lowest claim amount of 77,532, offering a contrasting perspective on the ACP's journey.
- Initial Phases: This could reflect the program's nascent stage or lower initial awareness among the eligible population.
- Growth Trajectory: The increase from this point onwards highlights the program's growing impact over time.
Yearly Comparison
Comparing the total claim amounts for 2022 and 2023 (up to August) reveals evolving dynamics within the ACP.
- Consistent Engagement: With total claims of 1,405,388 in 2022 and 1,401,350 in 2023, there is a consistent level of engagement.
- Sustained Need: These numbers suggest a sustained need for the program across these years.
Average Monthly Claim
The average monthly claim amount of approximately 140,337 over this period indicates the steady utilization of the ACP.
- Reflects Regular Utilization: This average suggests a regular and ongoing usage of the ACP funds.
- Policy Consistency: It also indicates a level of consistency in policy implementation and fund disbursement.
August 2023 Specifics
August 2023's claim amount of 147,523 holds its significance in the overall analysis.
- Comparative Analysis: While not the highest, it still represents a significant figure in the latter part of the studied period.
- Trend Indicator: This could potentially indicate the beginning of a new trend or a response to specific circumstantial changes.
Significant Changes
Notable changes in claim amounts in August 2023, August 2022, and July 2022 provide key insights.
- Fluctuation Analysis: These changes could be tied to seasonal variations, policy adjustments, or external economic factors.
- Understanding Impact: Analyzing these fluctuations helps understand the responsiveness of the program to external and internal changes.
Further Insights And Trends
Seasonal Trends
Analyzing the seasonal trends in claim amounts reveals patterns of utilization within the ACP.
- Quarterly Variations: The average claim amounts of approximately 117,116 and 175,169 in different quarters suggest seasonal influences on claim amounts.
- Policy Adaptation: This information could be crucial for adjusting program policies to seasonal needs.
Long-Term Trend
The long-term increasing trend in claim amounts over the entire period reflects the evolving landscape of digital connectivity needs.
- Growing Demand: This trend highlights an escalating demand for digital connectivity assistance.
- Future Projections: It underscores the importance of planning for continued or increased support through the ACP.
Highlighting Subsidy Relationship
Understanding the relationship between claim amounts and claimed subsidies is crucial for program efficacy.
- Subsidy Impact: Analyzing how subsidies influence claim amounts can reveal the effectiveness of subsidy policies.
- Beneficiary Behavior: Insights into beneficiary behavior in response to subsidies can guide future policy amendments.
Month-To-Month Variations
The ACP's responsiveness is further highlighted by the month-to-month variations in claim amounts.
- Responsive System: These variations indicate a system that is responsive to changing needs and conditions.
- Causal Factors: Investigating the causes of these variations can provide insights into beneficiary circumstances and program reach.
External Events Influence
The influence of external events on claim amounts is a critical aspect of understanding the ACP's operation in a real-world context.
- Economic And Policy Influences: Economic shifts, policy changes, and other external factors have a direct impact on claim amounts.
- Adaptive Strategies: Understanding this influence is key to adapting the ACP to external changes effectively.
National Trends Comparison
Comparing Minnesota’s claim amounts with national trends offers a broader perspective on the state’s performance and challenges.
- Benchmarking: This comparison helps in benchmarking Minnesota's ACP performance against other states.
- Best Practices: It can also assist in identifying best practices and areas for improvement.
Subsidy Impact On Claims
Discussing the impact of total claimed subsidies on claim amounts sheds light on the financial aspects of the ACP.
- Financial Analysis: It helps in understanding the financial dynamics of the program.
- Optimization: Insights from this analysis can be used to optimize subsidy distribution for maximum impact.
Understanding Trends To Minnesota's Connectivity Future
The period from January 2022 to August 2023 has been a testament to the critical role of the Affordable Connectivity Program in Minnesota. The varying claim amounts, influenced by numerous factors, including seasonal changes, policy shifts, and external events, highlight the dynamic nature of the program.
This analysis not only underscores the importance of the ACP in supporting digital connectivity but also provides valuable insights for future policy formulation and program enhancement. The continual adaptation and responsiveness of the ACP to the changing needs of Minnesota’s residents are key to ensuring that the digital divide is effectively addressed, making it a model for similar initiatives nationwide.
Read more about the difference between ACP and Lifeline when selecting affordable internet connectivity from our resources at Gov Relations.

- "ACP Enrollment and Claims Tracker." Universal Service Administrative Company, www.usac.org/acp-enrollment-and-claims-tracker/.
- "Affordable Connectivity Program." Federal Communications Commission, www.fcc.gov/acp.
- "Announcing Affordable Connectivity Program (ACP)." Minnesota Government - Office of Family Assistance, mn.gov/ombudfam/resources/?id=1105-527965.
- "Affordable Connectivity Program for Internet." Minnesota Government, mn.gov/deaf-hard-of-hearing/about-us/news-and-events/?id=1121-530999.